
|Articles|September 7, 2021
High Interferon Signaling and Antigen Presentation is Predictive of Response to Upfront Treatment of Advanced HCC
Author(s)Caroline Seymour

A study has shown that high interferon signaling and expression of MHC-II related genes can predict response to therapy is patients with advanced heptocellular carcinoma being treated for the first time.
Advertisement
Prediction of improvement progression-free survival (PFS) and overall survival (OS) in patients with advanced hepatocellular carcinoma (HCC) following immediate treatment with a PD-1 inhibitor occurred with biomarkers of response to immunotherapy, characterized by high interferon signaling and expression of MHC-II related genes, with the exception of patients who first received tyrosine kinase inhibitor therapy, according to findings from a study presented during the 2021 International Liver Cancer Association Conference.1
Interferon signaling and expression of MHC-II related genes are key molecular features of HCCs responding to PD-1 inhibitors. [However,] biomarkers fail to predict response if patients are undergoing TKI treatment between sample acquisition and anti–PD-1 treatment,” lead study author Philipp K. Haber, MD, a clinical researcher at the Icahn School of Medicine at Mount Sinai, said in a virtual presentation during the meeting.
Responses to PD-1 inhibitors in advanced HCC are heterogeneous. Although some patients will experience durable responses, with a median OS exceeding 26 months, most patients with advanced HCC have resistance to PD-1 monotherapy.
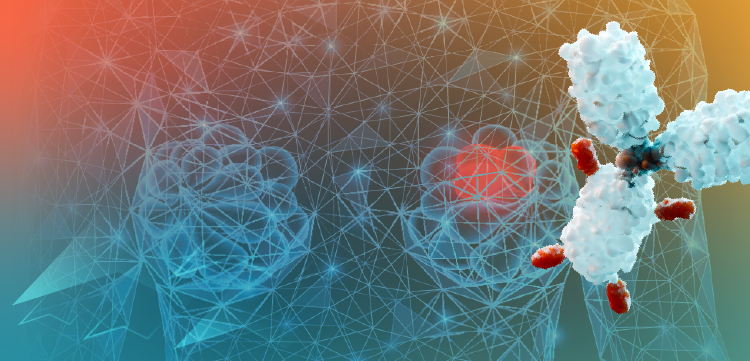
In other cancers, response to PD-1 inhibitors has been associated with an inflamed microenvironment with effector T cells and active interferon-γ signaling. Moreover, gene expression signatures that are defined by these markers have been shown to predict for response in melanoma.
In search of biomarkers of response that could better delineate expected responders from nonresponders in HCC, investigators conducted a multicenter study that evaluated tumor samples from patients with advanced HCC prior to treatment with PD-1 inhibitors.
The study enrolled patients with advanced HCC receiving PD-1 inhibitors across 13 centers spanning 7 countries. Eligible patients had to have Barcelona Clinic Liver Cancer (BCLC) stage C or BCLC stage B disease following progression on locoregional therapy; Child-Pugh A to B7 disease; at least 2 months of treatment with a PD-1 inhibitor; and at least 1 response assessment per modified RECIST v1.1 criteria.
“Interferon signaling and expression of MHC-II related genes are key molecular features of HCCs responding to PD-1 inhibitors. [However,] biomarkers fail to predict response if patients are undergoing TKI treatment between sample acquisition and anti–PD-1 treatment,” lead study author Philipp K. Haber, MD, a clinical researcher at the Icahn School of Medicine at Mount Sinai, said in a virtual presentation during the meeting.
Responses to PD-1 inhibitors in advanced HCC are heterogeneous. Although some patients will experience durable responses, with a median OS exceeding 26 months, most patients with advanced HCC have resistance to PD-1 monotherapy.
In other cancers, response to PD-1 inhibitors has been associated with an inflamed microenvironment with effector T cells and active interferon-γ signaling. Moreover, gene expression signatures that are defined by these markers have been shown to predict for response in melanoma.
In search of biomarkers of response that could better delineate expected responders from nonresponders in HCC, investigators conducted a multicenter study that evaluated tumor samples from patients with advanced HCC prior to treatment with PD-1 inhibitors.
The study enrolled patients with advanced HCC receiving PD-1 inhibitors across 13 centers spanning 7 countries. Eligible patients had to have Barcelona Clinic Liver Cancer (BCLC) stage C or BCLC stage B disease following progression on locoregional therapy; Child-Pugh A to B7 disease; at least 2 months of treatment with a PD-1 inhibitor; and at least 1 response assessment per modified RECIST v1.1 criteria.
A total of 111 patient samples were collected, reflecting 40 patients treated in the frontline setting, 54 treated in the second-line setting, and 17 treated in the third-line setting. A total of 28 samples were removed from assessment because of inadequate tumor availability (n = 23), failed quality control (n = 4), and late response assessment that was performed after 2 weeks (n = 1).
Notably, the tissue sample was collected prior to the start of any systemic therapy, meaning prior to PD-1 inhibition in the frontline setting and prior to TKI therapy in the second- and third-line setting.
A total of 83 samples underwent transcriptomic analysis. Among frontline samples (n = 28), 23 underwent CTNNB1 mutational analysis and 16 underwent immunohistochemistry (IHC). Among second- and third-line samples (n = 55), 44 underwent CTNNB1 mutational analysis and 40 underwent IHC.
The results showed that responders had significantly longer median PFS (P < .0001) and OS (P = .00065) compared with those who experienced stable disease or progressive disease with PD-1 inhibition.
Moreover, 43% (n = 12) of patients treated in the frontline setting had an objective response. The benefit in median PFS (P < .0001) and OS (P = .0018) was maintained among responders vs nonresponders in the frontline setting.
Molecular analysis of responders in the frontline setting revealed that response to PD-1 inhibition was associated with an enrichment in interferon-γ signaling, MHC-II formation, and MHC-II dependent antigen presentation.
CTNNB1 mutations, present in responders and nonresponders, were not associated with PD-1 resistance, although CTNNNB1 mutant–responders had enriched inflammatory signaling compared with CTNNNB1 mutant–nonresponders. Here, the difference between responders and nonresponders with CTNNNB1 mutations was not significant for PFS (P < .0001) or OS (P = .031).
“This suggests that patients with β-catenin mutations that drives immune exclusion are resistant to anti–PD-1 [inhibitors], but if mechanisms are at play that help overcome this immune exclusion phenotype, patients might still respond despite having a mutation in β-catenin,” said Haber.
In integrating the known molecular classes of HCC with the response patterns observed in the study, investigators found a significant enrichment in Hoshida S1 and S2 classes and an inflamed HCC subgroup.
Additionally, interferon signatures (P = .0016), inflammatory signatures (P = .0046), POPLAR (P = .02), and cytolytic activity (P = .14) was enriched in responders vs nonresponders. However, these signatures were not shown to be associated with improved OS using previously defined cutoffs (P = .15; P = .11; P = .83; P = .26, respectively).
Designing and validating an alternative, 11-gene signature, titled interferon signaling and antigen presentation (INFAP), investigators showed that INFAP expression is associated with unique microenvironmental composition.
Specifically, enrichment in this population was noted in several cellular subsets, including that of CD4 naïve T cells (P = .026), CD4 memory activated T cells (P = .0064), and M1 macrophages (P = .0029), whereas regulatory T cells (P = .001) were enriched in INFAP low–nonresponders.
“High expression of INFAP and response was not linked to an overall higher immune infiltrate, both within the tumor and the border area, suggesting that maybe the composition rather than the overall quantity seems to be a driving force,” said Haber.
Notably, a significant improvement in PFS (P = .035) and OS (P = .039) was reported in INFAP-enriched responders vs INFAP nonenriched nonresponders, and the signature captured responders at an area under the curve of 0.87.
In the second- and third-line cohort, responders had improved PFS (P < .0001) and OS (P = .047) vs nonresponders. However, neither INFAP or other markers predicted for response in patients who received TKIs between tissue collection and treatment with a PD-1 inhibitor.
“This led us to postulate that TKIs interfere with the readout of these biomarkers,” said Haber.
In an exploratory analysis comparing responders and nonresponders with high and low INFAP, nonresponders with low INFAP had a significant enrichment in metabolic pathways and regulatory T cells (P = .0084), “suggesting these to be mechanisms of resistance that cannot be overcome with prior TKI therapy,” said Haber.
Moreover, INFAP high–nonresponders had enrichment in aggressive phenotype signatures and CD4-naïve T cells (P = .012).
“Interestingly, these are the patients that respond when treated with PD-1 inhibitors in the frontline setting, suggesting that TKIs in these patients might be detrimental. Precision oncology requires fresh biopsies prior to the start of immunotherapy or maybe any systemic therapy to begin with,” concluded Haber.
Reference
Haber PK, Castet F, Torres-Martin M, et al. Molecular markers of response to anti-PD1 therapy in advanced hepatocellular carcinoma. Presented at: 2021 International Liver Cancer Association Conference; September 2-5, 2021; virtual. General Session 1.
Advertisement
Related Content
Advertisement


Advertisement
Advertisement
Trending on Targeted Oncology - Immunotherapy, Biomarkers, and Cancer Pathways
1
FDA Approves Subcutaneous Isatuximab for Multiple Myeloma
2
FDA Approves Perioperative Pembrolizumab Plus Enfortumab Vedotin for MIBC
3
Osimertinib After Chemoradiotherapy Shows Manageable Safety in NSCLC
4
FDA Clears IND for Next-Gen Oncolytic Virus UGN-501 in NMIBC
5